
Analysis: Trends in CRA Reports to Parliament Regarding SR&ED

The Canadian Parliament in Ottawa. Photo by Saffron Blaze, via http://www.mackenzie.co licensed under CC BY-SA 3.0.
Since 1999 the Canada Revenue Agency (CRA) has provided the Canadian Treasury with “a comprehensive report on the performance of the CRA for the previous fiscal year, and a discussion of the CRA’s achievements against the key targets and indicators set out in our Corporate Business Plan and Departmental Plan.” Initially, the CRA would produce both an Annual Report to Parliament and a Departmental Performance Report, however, the Annual Report to Parliament was discontinued in 2015 to avoid duplication.1
The Canada Revenue Agency (CRA) is:
Responsible for administering, assessing, and collecting hundreds of billions of dollars in tax revenues annually. The money the CRA collects is used by federal, provincial, territorial and First Nations governments to fund important social programs, provide essential services, and build and maintain the infrastructure needed for continued economic prosperity. The CRA also directly delivers billions of dollars in benefits and tax credits that contribute to the well–being of Canadian families, children, seniors, and persons with disabilities. 2
Prior to 2015, the CRA was required to provide an annual report to the Treasury Board of Canada that detailed their income, expenditures, program improvements, and other details regarding the organization. Departmental Performance Reports replaced the CRA Annual Report to Parliament after the final, 2014 Annual Report was published
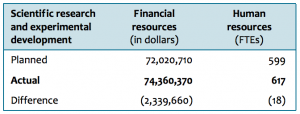
2016-2017
Source: Government of Canada. The Honourable Diane Lebouthillier, P.C., M.P. Minister of National Revenue. (2017.) 2016-17 Departmental Performance Report. Scientific Research and Experimental Development. pg. 60. Retrieved December 29, 2017, from: https://www.canada.ca/content/dam/cra-arc/corp-info/aboutcra/dprtmntl-prfrmnc-rprts/2016-2017/drr17cra-en.pdf
The CRA provides tax assistance and investment tax credits to Canadian businesses as an incentive to conduct qualifying industrial research and development activities and film or video production activities in Canada. Of note is the fact that the Agency’s Scientific Research and Experimental
Development (SR&ED) Program is one of the largest government programs to support research and development in Canada, significantly advancing one of the Government’s key strategic priorities.Through the SR&ED Program (and the Film and Media Tax Credits Program), the CRA ensures that all claims comply with applicable legislative requirements and government policies. The Agency also ensures that applicants have the information and timely services they need to access investment tax credits and that the tax credits or cash refunds are delivered in a prompt, consistent, and predictable manner.
We process approximately 21,000 claims every year under the SR&ED program. Meanwhile, approximately 6,500 claims are processed each year for the Film and Media Tax Credits Program.
In 2016, the Agency launched two services to give businesses, especially small and medium-sized enterprises, a degree of certainty about their eligibility for SR&ED tax incentives before filing a claim.
- A pre-claim consultation service began in June 2016 and provides potential SR&ED tax credit claimants with an evaluation of whether their research and development work would generally qualify as scientific research or experimental development under the Income Tax Act. The service
is provided only at the request of the potential claimant and is based on the information that the claimant provides.- In August 2016, a pre-claim review process was launched. This service gives claimants, on request and before a claim is filed, a determination of how much research and development work undertaken by the claimant would be eligible under the SR&ED program, and what specific expenditures would qualify for the SR&ED tax credits. Unlike the pre-claim consultation
service, the pre-claim review involves an analysis of the extent of the work conducted by the potential claimant.Key Results
In 2016-2017:
- Our SR&ED program provided more than $2.7 billion in investment tax credits in support of industrial research and development.
- Total dollar fiscal impact for SR&ED was $349 million.
2015-2016
Source: Government of Canada. The Honourable Diane Lebouthillier, P.C., M.P. Minister of National Revenue. (2016.) 2015-16 Departmental Performance Report. Scientific Research and Experimental Development. pg. 61. Retrieved December 29, 2017, from: https://www.canada.ca/content/dam/cra-arc/migration/cra-arc/gncy/prfrmnc_rprts/2015-2016/dpr-2015-16-eng.pdf
2. Canada Revenue Agency. (2014.) Annual Report To Parliament 2013-2014. Scientific Research and Experimental Development. pg. 41-42. Retrieved December 29, 2017, from: https://www.canada.ca/content/dam/cra-arc/migration/cra-arc/gncy/nnnl/2013-2014/ar-2013-14-eng.pdf
The Scientific Research and Experimental Development (SR&ED) Program provides tax incentives to Canadian businesses to do qualifying industrial research and development in Canada. The SR&ED program is designed to encourage businesses to do scientific research and experimental development by providing more than $3 billion in investment tax credits to over 19,000 claimants annually. SR&ED activity can benefit other businesses and the Canadian economy as a whole. The CRA’s role is to make sure all SR&ED claims comply with the law.
Based on the positive feedback received from claimants participating in the project testing of a formal pre-approval of their SR&ED claims, in 2015-16 the CRA evaluated the feasibility of implementing a full national rollout of this service. As a result, we developed a new pre-claim consultation service and a new pre-claim review pilot to provide predictability and further reduce the administrative burden on businesses making SR&ED claims.
The CRA launched a new strategy in 2015-2016 to focus on enhancing service, engagement, and outreach to those who could benefit from the SR&ED tax incentives. To increase awareness of the SR&ED program, we engaged other government agencies and departments serving clients who may benefit from accessing the SR&ED tax incentives. These partnerships sparked further collaborations, such as meetings with clients, key associations, and industry representatives. The CRA held two SR&ED symposiums last year in partnership with stakeholders to enhance compliance by meeting with tax preparers to identify and address emerging issues.
Key results
- Our SR&ED program processed 22,839 claims.
- Our SR&ED program provided more than $3 billion in investment tax credits in support of industrial research and development.
2014-2015
Source: Canada Revenue Agency. (2015.) Annual Report To Parliament 2014-2015. Scientific Research and Experimental Development. pg. 57. Retrieved December 29, 2017, from: https://www.canada.ca/content/dam/cra-arc/migration/cra-arc/gncy/nnnl/2014-2015/ar-2014-15-eng.pdf
The Scientific Research and Experimental Development (SR&ED) program provides tax assistance and investment tax credits to Canadian businesses as an incentive to conduct qualifying industrial research and development activities in Canada. The CRA’s role is to make sure all claims under these programs are made in accordance with legislative requirements.
To reduce the administrative burden on companies making SR&ED claims, we continued our feasibility study of a formal pre-approval process for those claims. The study includes a three-year pilot project with businesses across Canada. The CRA worked to increase awareness of the SR&ED program in 2014-2015 through outreach and stakeholder engagement activities including the following:
- We posted four videos on the CRA’s YouTube channel, focusing on an overview of the SR&ED program, what type of work and expenditures qualify for the SR&ED tax incentives, how to calculate the SR&ED investment tax credit, and how to file a claim.
- We piloted webinars featuring current information and an explanation of the SR&ED program. The pilot was a success and, due to the positive feedback and overwhelming demand from participants, the CRA began providing these webinars on an on-going basis on April 1, 2015.
- We collaborated with other government departments, such as the Canadian Intellectual Property Office, Department of Foreign Affairs, Trade and Development, Export Development Canada, and National Research Council – Concierge Service, on cross-promotional opportunities for the SR&ED program.
- We partnered with the Chartered Professional Accountants of Canada and the Association de planification fiscale et financière to coordinate two symposiums to promote and discuss the SR&ED program.
- We continued to engage tax preparers and industry associations to address emerging issues related to the program.
Each year, the Agency processes over 24,000 SR&ED claims
Key results
- The SR&ED program processed 24,302 claims.
- The program provided more than $3.1 billion in tax assistance in support of industrial research and development.
- The CRA identified over $394 million in non-compliance.
2013-2014
Source: Canada Revenue Agency. (2014.) Annual Report To Parliament 2013-2014. Scientific Research and Experimental Development. pg. 41. Retrieved December 29, 2017, from: https://www.canada.ca/content/dam/cra-arc/migration/cra-arc/gncy/nnnl/2013-2014/ar-2013-14-eng.pdf
2. Canada Revenue Agency. (2014.) Annual Report To Parliament 2013-2014. Scientific Research and Experimental Development. pg. 41-42. Retrieved December 29, 2017, from: https://www.canada.ca/content/dam/cra-arc/migration/cra-arc/gncy/nnnl/2013-2014/ar-2013-14-eng.pdf
The Scientific Research and Experimental Development (SR&ED) program provides tax assistance and investment tax credits to Canadian businesses as an incentive to conduct qualifying industrial research and development activities in Canada. The CRA also administers film and media tax credits. The CRA’s role is to ensure all claims under these programs are made in accordance with legislative requirements.
We review the technical and financial aspects of all claims submitted to ensure the work and expenditures claimed meet the specific requirements of the Income Tax Act. We also focus on identifying high-risk claims and ensure the program operates as intended.
Because the scientific research and experimental development tax credit is the largest single source of federal government support for industrial R&D in Canada, we work hard to give applicants the information and timely access to services they need. Our goal is to make sure tax credits or cash refunds are delivered quickly, consistently, and predictably.
In 2013-2014:
- In January 2014, the SR&ED program launched the self-assessment learning tool. This online tool helps businesses determine if their R&D work meets the requirements for the SR&ED program. It includes focused questions, clear explanations, and tips on how to structure an SR&ED claim.
- The CRA introduced the First-Time Claimant Advisory Service. This service provides in-person help for first-time SR&ED claimants. Local CRA staff meet with first-time claimants at their place of business to help them to better understand the SR&ED program and to give them the tailored information they need for a successful claim.
- In January 2014, we began piloting webinars on the SR&ED program. These webinars are designed to complement the in-person seminars currently held across the country.
These new initiatives are designed to help SR&ED claimants successfully access the SR&ED program and benefit from the incentives it offers. By proactively supporting our clients and helping them become better informed, we are increasing their chances of a successful claim, reducing the time lost through processing delays, and lowering their administrative burden. This additional support is expected to give SR&ED claimants more opportunities to create jobs and grow Canada’s economy.
Key results:
- The SR&ED program processed 24,794 claims.
- The program provided more than $3.3 billion in tax assistance in support of industrial research and development.
- The CRA identified over $534 million in non-compliance.
2012-2013
Source: Canada Revenue Agency. (2013.) Annual Report To Parliament 2012-2013. Scientific Research and Experimental Development. pg. 51-52. Retrieved December 29, 2017, from: https://www.canada.ca/content/dam/cra-arc/migration/cra-arc/gncy/nnnl/2012-2013/images/ar-2012-13-eng.pdf
The Scientific Research and Experimental Development (SR&ED) Program is an important federal tax incentive program administered by the CRA. It provides support to Canadian businesses to encourage research and development (R&D) in Canada. The SR&ED Program offers claimants tax incentives in the form of income tax deductions and investment tax credits based on their expenditures like wages, materials, and machinery on eligible SR&ED work done in Canada.
The Income Tax Act provides a definition of scientific research and experimental development and describes eligible SR&ED work and expenditures. We give information and services to help businesses determine if their R&D work and expenditures are eligible for these tax incentives.
We review the technical and financial aspects of all SR&ED claims. This is an important check to ensure that the program operates as intended and that SR&ED work and expenditures meet the specific requirements defined in theIncome Tax Act. Our focus is on identifying high-risk claims and using a more tailored strategy to address key areas of concern.
In 2012-2013, the CRA started work on a number of initiatives to improve the predictability and the accessibility of the SR&ED Program.
- The CRA released new, consolidated SR&ED policy documents and reorganized its SR&ED Web page content to present information in a more user-friendly way. The goal of this initiative was to make compliance easier by clarifying and simplifying SR&ED policies.
- The CRA is improving its self-assessment and learning tool, which is designed to assist businesses in determining the eligibility of their R&D work for SR&ED tax incentives. We expect to release this updated tool in 2013-2014.
- The CRA launched a pilot project to establish the feasibility of a formal pre-approval process (FPAP) for SR&EDclaims. The FPAP will provide better certainty to businesses on the eligibility of their SR&ED claims before filing. During the pilot, the CRA will be working with a number of businesses to receive feedback on FPAP.
- We increased our engagement with stakeholders by meeting with industry representatives to discuss and address emerging SR&ED program issues. These discussions will continue to be held regularly.
Our results indicate that more businesses are receiving tax assistance over time. In addition, we continued to meet our performance targets for our four service standards for the processing of SR&ED claims and requests.
Key results:
- The CRA provided more than $3.6 billion in tax assistance in support of industrial research and development
- The CRA processed 28,140 claims, compared to 28,993 in 2011-2012
- The CRA provided tax assistance to over 23,000 claimants through the SR&ED Program, an increase of 27% over the number of claimants who received tax assistance five years ago
- The CRA processed 96% of SR&ED refundable and non-refundable claims within 120 days and 365 days respectively, well above our target of 90%
- The CRA identified $404 million in non-compliance, compared to $424 million in 2011-2012
2011-2012
Source: Canada Revenue Agency. (2012.) Annual Report To Parliament 2011-2012. Scientific Research and Experimental Development. pg. 31. Retrieved December 29, 2017, from: https://www.canada.ca/content/dam/cra-arc/migration/cra-arc/gncy/nnnl/2011-2012/images/ar-2011-2012-eng.pdf
In 2011, our Scientific Research and Experimental Development (SR&ED) program provided more than $3.6 billion in tax assistance to over 23,000 claimants, an increase of $100 million over the previous year. We also ensure that businesses prepare their claims in compliance with tax laws, policies, and procedures. As a result of those efforts, we identified and addressed $425 million of non‑compliance last year.
During 2011-2012, we continued to consolidate and clarify our current SR&ED policy documents and related guidance to help claimants better understand how the program works. Online public consultations ended in February 2012 and we expect to report the results in our 2012-2013 Annual Report to Parliament.
In October 2011, the Research and Development Review Expert Panel released its report to the Government of Canada on its review of federal support for research and development. The panel noted that the SR&ED program plays a fundamental role in lowering the costs of industrial Research and Development (R&D) for businesses, enhancing investment in R&D, and making Canada a more attractive place to locate R&D. The panel also provided recommendations to the Government of Canada on how to improve support for businesses and help them grow into larger, globally competitive companies. In the 2012 Federal Budget, informed by the advice of the Research and Development Review Expert Panel, the Government of Canada announced a number of legislative measures to simplify the SR&ED program and make it more cost‑effective, and administrative measures to enhance the predictability of the program. Over the next few years, the CRA will be implementing these measures.
2010-2011
Source: Canada Revenue Agency. (2011.) Annual Report To Parliament 2010-2011. Scientific Research and Experimental Development. pg. 44. Retrieved December 29, 2017, from: https://www.canada.ca/content/dam/cra-arc/migration/cra-arc/gncy/nnnl/2010-2011/prfrmnc-e/rc4425-11-eng.pdf
The CRA oversees the integrity of various tax incentives that promote economic growth in Canada, such as the Scientific Research and Experimental Development (SR&ED) program. The SR&ED program is the largest single source of federal government support for industrial research and development. The CRA strives to deliver the tax incentives in a timely, consistent, and predictable manner, while ensuring businesses prepare their claims in compliance with tax laws, policies and procedures.
During 2010-2011, the SR&ED program provided about $3.5 billion in tax assistance to over 21,000 claimants. In addition, as a result of our risk assessment process, in 2010-2011, we identified and addressed $473 million of non‑compliance, an increase of 5.6% from the previous period.
2009-2010
Source: Canada Revenue Agency. (2010.) Annual Report To Parliament 2009-2010. Our 2009-2010 Priorities. Strengthening Service. Scientific Research and Experimental Development. pg. 72. Retrieved December 29, 2017, from: https://www.canada.ca/content/dam/cra-arc/migration/cra-arc/gncy/nnnl/2009-2010/prfrmnc-e/rc4425-10-eng.pdf
In the 2008 federal budget, the CRA committed to enhancing the quality assurance methodology of the Scientific Research and Experimental Development (SR&ED) program. In 2008-2009, we consulted with stakeholders and, in turn, developed a national SR&ED quality assurance framework. This framework will help ensure SR&ED claims and decisions are appropriate and consistent with CRA policies and the governing legislation across the country. Based on this framework, the SR&ED Quality Assurance Operations manual and the requisite tools were developed in 2009-2010.
In the 2008 Federal Budget, the CRA also committed to reviewing the SR&ED policies and procedures. In 2009-2010, we analyzed, organized, and clarified all SR&ED policy information. Over the next two years, the SR&ED program will be conducting online consultations to get the public’s feedback on the new policy documents.
In 2009, Canada’s SR&ED program provided about $3.3 billion in assistance to over 21,000 claimants.
In 2009-2010, we expanded the filing capabilities of the CRA’s Corporation Internet Filing service to allow eligible corporations to file their SR&ED claims, with their income tax returns, using the internet.
Back to Top
2008-2009
Source: Canada Revenue Agency. (2009.) Annual Report To Parliament 2008-2009. Our 2008-2009 Priorities. Strengthening Service. Scientific Research and Experimental Development. pg. 60. Retrieved December 29, 2017, from: https://www.canada.ca/content/dam/cra-arc/migration/cra-arc/gncy/nnnl/2008-2009/prfrmnc-e/rc4425-09-eng.pdf
To strengthen service delivery, we focused on increasing accessibility to, and the efficiency of, the Scientific Research and Experimental Development (SR&ED) tax incentive program. In 2008, Canada’s SR&ED program provided about $4 billion in tax assistance to over 18,000 claimants.
During 2008-2009, we made it easier for businesses to apply for this tax incentive by publishing a simplified claim form and associated guide, as well as a new CD-ROM, brochure and leaflet. In addition, we developed a Web-based SR&ED Eligibility Self-Assessment Tool (ESAT) to help claimants identify whether their research and development projects may qualify under the program. Statistics on Web visits to our SR&ED home page indicate that awareness of the SR&ED program has increased, which we attribute, in part, to the release of these new products.
Priority: Enhance our administration of the scientific research and experimental development (SR&ED) tax credit
Achievements: In 2008-2009, we:
- redesigned our SR&ED Web pages;
- produced a CD-ROM that gives an overview of the SR&ED program and acts as a portal to our SR&ED Web pages; and
- published a new brochure and leaflet that provides a one-stop source of information on SR&ED.
For more information on the CRA’s administration of this federal incentive program please refer to www.cra.gc.ca/sred.
2007-2008
Source: Canada Revenue Agency. (2008.) Annual Report To Parliament 2007-2008. A Snapshot of Reporting Compliance (PA4). Scientific Research and Experimental Development. pg. 59. Retrieved December 29, 2017, from: https://www.canada.ca/content/dam/cra-arc/migration/cra-arc/gncy/nnnl/2007-2008/prfrmnc-e/rc4425-08eng.pdf
[The Scientific Research and Experimental Development Program] provides more than $4 billion in tax credits to almost 18,000 claimants.
2006-2007
Source: Canada Revenue Agency. (2007.) Annual Report To Parliament 2006-2007. Scientific Research and Experimental Development. pgs. 57 and . Retrieved December 29, 2017, from: https://www.canada.ca/content/dam/cra-arc/migration/cra-arc/gncy/nnnl/2006-2007/prfrmnc-e/rc4425-07eng.pdf
Annually, the Scientific Research and Experimental Development (SR&ED) tax incentive program provides more than $3.0 billion in tax credits to over 18,000 claimants as an incentive to conduct qualifying industrial research and development activities in Canada. A prompt and thorough review of the applications for these tax credits demonstrates the CRA’s commitment to effective administration of the related programs and fosters reporting compliance. In 2006-2007, we met all of our external service standards in the SR&ED and Film and Video tax credit programs.4
[…] [The Scientific Research and Experimental Development Program] annually provides more than $3.0 billion in tax credits to over 18,000 claimants. 5
2005-2006
Source: Canada Revenue Agency. (2006.) Annual Report To Parliament 2005-2006. Assessment of Returns and
Payment Processing (PA2). Scientific Research and Experimental Development. pg. 38. Retrieved December 29, 2017, from: https://www.canada.ca/content/dam/cra-arc/migration/cra-arc/gncy/nnnl/2005-2006/prfrmnc-e/r_2005-06-eng.pdf
[The] Scientific Research and Experimental Development Program […] provides investment credits as an incentive to conduct qualifying industrial research and development activities in Canada:
- spending of $52.7 million (520 FTEs); and
- provided $1.8 billion in tax credits.